Back
5 Sep 2018
USD/TRY Technical Analysis: ascending triangle on 1H chart, upside calling
- The USD/TRY pair has charted an ascending triangle, a bullish pattern, on the hourly chart.
- The short-term moving averages (MAs) - 5-day, 10-day - are trending north, indicating a bullish setup and the hourly relative strength index (RSI) has also adopted a bullish bias.
- A break above the top end of the triangle looks likely and would strengthen the bull grip and allow a rally to 6.8354 (Aug. 30 high) - record highs above 7.00.
Hourly Chart
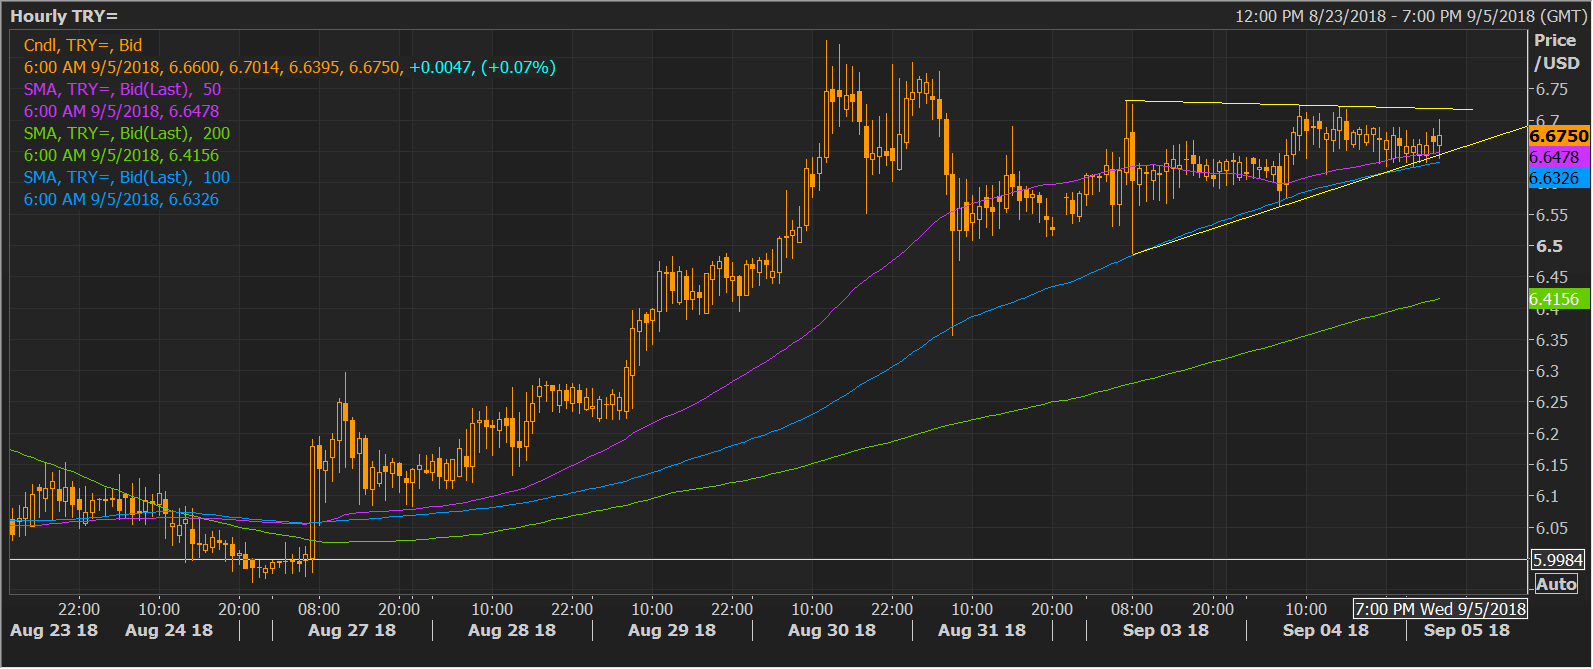
Spot Rate: 6.86
Daily High: 6.6992
Daily Low: 6.6416
Trend: Bullish
Resistance
R1: 6.8354 (Aug. 30 high)
R2: 7.00 (psychological hurdle)
R3: 7.08 (record high)
Support
S1: 6.63 (50-hour moving average)
S2: 6.57 (previous day's low)
S3: 6.51 (Sep. 3 low support on the hourly chart)